It's a New Day in Public Health.
The Florida Department of Health works to protect, promote, and improve the health of all people in Florida through integrated state, county, and community efforts.
Varicella (Chickenpox) in Florida
Florida Health
Disease Control- DiseaseControl@flhealth.gov
- 850-245-4444
-
Florida Health
4052 Bald Cypress Way
Tallahassee, FL 32399
February Key Points
outbreaks
highest incidence
up-to-date or
unknown vaccinations status
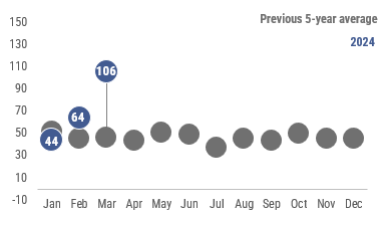
The number of varicella cases reported in February 2024 increased from the previous month and was above the previous 5-year average. Due to robust vaccination programs, there is no longer discernable seasonality for varicella cases in the United States.
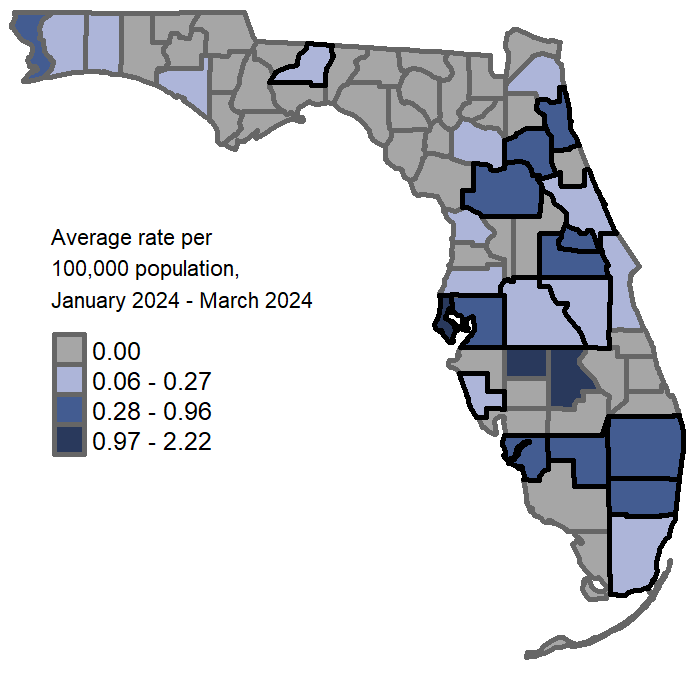
In February 2024, 71 varicella cases were reported in 23 counties, outlined in black in the map. From December 2023 through February 2024 the average county rates varied throughout the state.
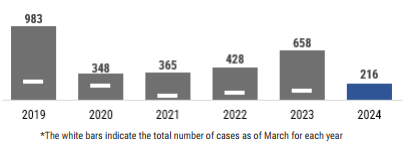
In 2024, 125 varicella cases were reported. The annual number of reported varicella cases increased from 2018 to 2019 and decreased significantly in 2020, 2021 and 2022. Cases reported in 2023 returned to levels similarly observed prior to the 2020 pandemic.
*CDC MMWR report year
In February, the varicella rate was highest among <1 year olds at 3.01 cases per 100,000 population. Infants <1 year old are too young to receive varicella vaccination, which is why vaccination of siblings, parents, grandparents and other age groups is important in infection prevention among infants.
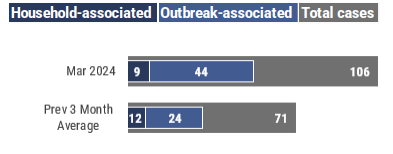
In February, 7 cases were household-associated and 22 case were outbreak-associated. For most varicella cases, exposure to other known cases is not identified. In Florida, transmission setting is not routinely identified for non-outbreak cases, resulting in 41% of cases reporting unknown setting in February.
People with shingles infection can transmit the virus that causes varicella to people without immunity. In February, 11 cases reported having contact with someone diagnosed with shingles during their exposure period.
*Note: This page contains materials in the Portable Document Format (PDF). The free Acrobat Reader may be required to view these files.

Connect with DOH