It's a New Day in Public Health.
The Florida Department of Health works to protect, promote, and improve the health of all people in Florida through integrated state, county, and community efforts.
Hepatitis A in Florida
Hepatitis A information line
- HepA@flhealth.gov
- 1-844-CALL-DOH (844-225-5364)
Toll free: Mon–Fri 8 a.m.-5 p.m.
April Key Points
The number of reported hepatitis A cases in April increased from the previous month and was below the previous 5-year average.
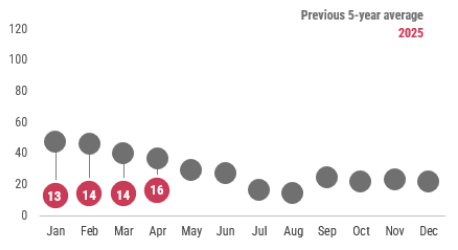
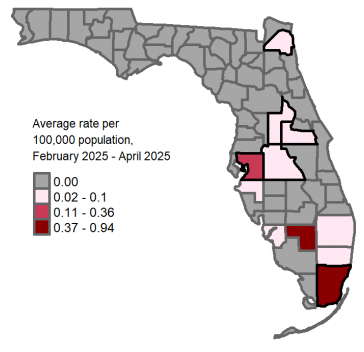
In April 2025, 16 hepatitis A cases were reported in 6 counties, outlined in black in the map below. From February 2025 through April 2025, the average county rates were lowest in northwest Florida.
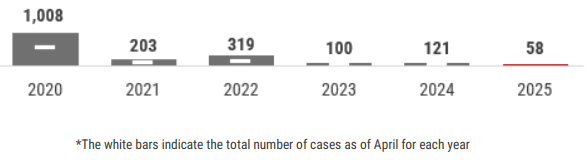
In 2025, 58 hepatitis A cases † were reported.
†CDC MMWR report year
The best way to prevent hepatitis A infection is through vaccination. In April 2025, 69% of cases were not up-to-date on hepatitis A vaccinations and 19% had unknown vaccination status. Since 2006, hepatitis A vaccine has been recommended for all children at age 1 year. Hepatitis A vaccine is also recommended for certain adult high-risk groups, including persons using injection and non-injection drugs, persons experiencing homelessness, and men who have sex with men. To learn more about the hepatitis A vaccine, talk to your doctor or visit: CDC.gov/Vaccines/HCP/VIS
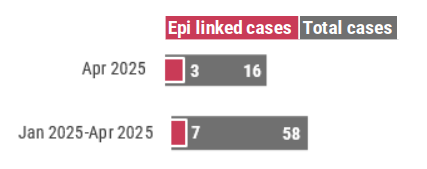
In April 2025, three casea were epidemiologially (epi) linked to another case.. From January to April 2025, seven cases were epidemiologically (epi) linked to another case.
In April 2025, there was an average of 1 contact to reported cases. Contacts are those who were exposed to the virus and recommended prophylaxis for illness prevention.

Connect with DOH