Skip Global navigation and goto content

It's a New Day in Public Health.

The Florida Department of Health works to protect, promote, and improve the health of all people in Florida through integrated state, county, and community efforts.

Skip MegaMenu and goto content
Megamenu requires javascript to be enabled in your browser.
* Enter the following to confirm subscription

Pertussis (Whooping Cough)

Florida Health

Disease Control

March Key Points

24 Cases
84 cases in the past
6 months
One outbreak of 2 cases
<1 year olds had
highest 6 month incidence


The number of pertussis cases reported in March increased from the previous month, and was above the previous 5-year average.

A graph showing a summary of pertussis cases reported by month in 2024 as compared to the previous 5-year average. In March 2024, 24 cases of pertussis were reported, which is above the previous 5-year average.


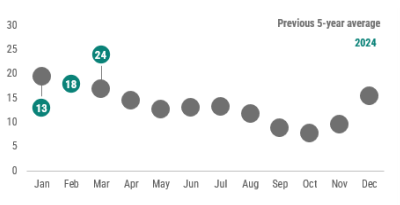
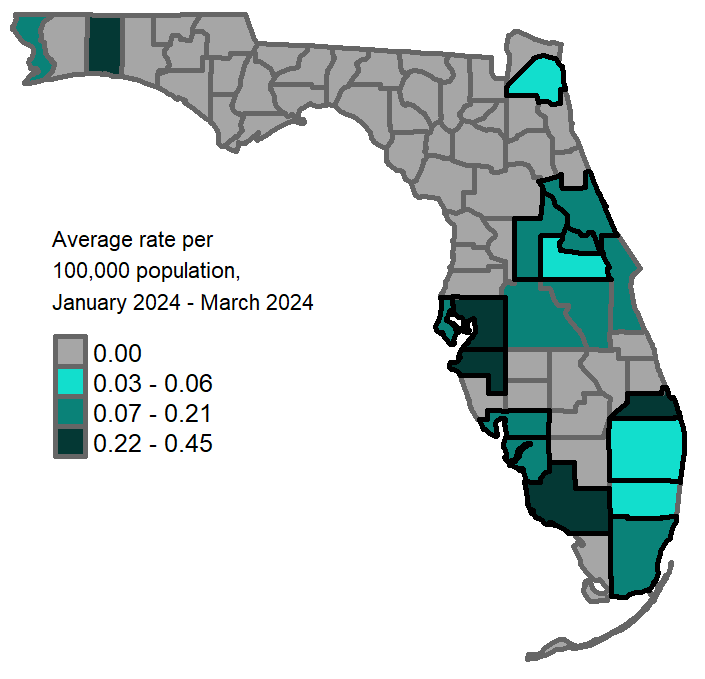
In March 2024, 24 Pertussis cases were reported in 14 counties, outlined in black in the map below. From January 2023 through March 2024 the average county rates varied throughout the state.

A map showing the previous 3-month average pertussis rates per 100,000 population. Counties with one or more cases reported in March  are  Brevard Broward Collier Miami-Dade Hillsborough Manatee Okaloosa Osceola Pinellas Polk  Counties with a rate of 0.03-0.05 per 100,000 population are: Broward Pinellas Counties with a rate of 0.06-0.17 per 100,000 population are:  Miami-Dade Polk Escambia Brevard Osceola Manatee Counties with a rate of 0.18-0.45 per 100,000 population are: Hillsborough Collier Okaloosa


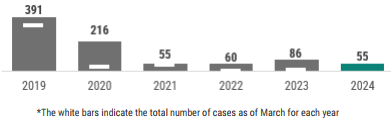
In 2024, 55 pertussis cases were reported.

A graph showing a summary of the total number of pertussis cases reported by year with an emphasis on 2019. In total for each year there have been: 391 in 2019; 216 in 2020; 55 in 2021, 60 in 2022, 86 in 2023, and 55 in 2024.


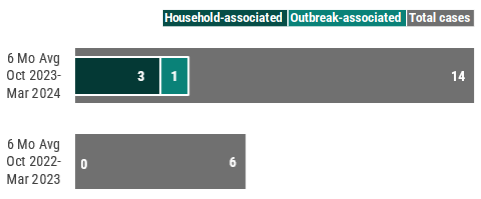
In March 2024, five pertussis cases were household-associated. One pertussis cases was outbreak-associated. In the past 6 months, there was an average of 3 household-associated cases, and an average of 1 outbreak-associated case and an average of 14 total cases. From October 2022 to March 2023, there was an average of 0 household-associated cases, an average of 0 outbreak-associated cases and an average of 6 total cases. For most pertussis cases, exposure to other known cases is not identified and are not able to be linked to outbreaks.

A graph showing a bar graph of the average number of total cases compared to the average number of household-associated cases and the average number of outbreak-associated cases for September 2023 - March 2024 and September  2023 - March  2024. There was an average of 1 household-associated cases between September 2023 - March 2024 and an average of 2 household-associated cases between September 2023 and March 2024.


*Note: This page contains materials in the Portable Document Format (PDF). The free Acrobat Reader may be required to view these files.