Skip Global navigation and goto content

It's a New Day in Public Health.

The Florida Department of Health works to protect, promote, and improve the health of all people in Florida through integrated state, county, and community efforts.

Skip MegaMenu and goto content
Megamenu requires javascript to be enabled in your browser.
* Enter the following to confirm subscription

Mumps in Florida

Florida Health

Disease Control

Mumps Surveillance
2020 Yearly Summary

The COVID-19 pandemic affected health care seeking behavior, which may be impacting the diagnosis and reporting of mumps that are shown in this report. For more information on the COVID-19 pandemic in Florida, please visit FloridaHealthCOVID-19.gov.


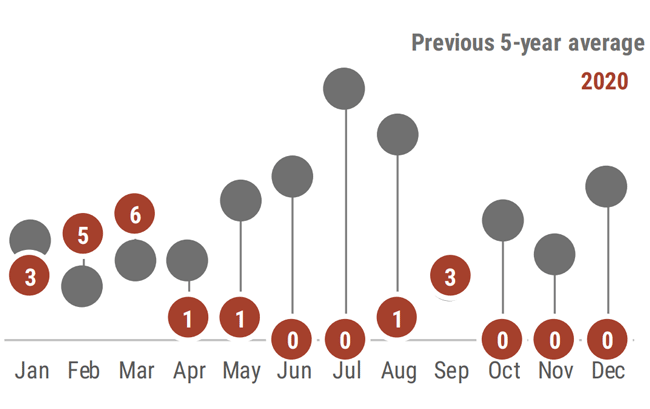
Mumps cases decreased below the previous 5-year average in April and remained low for the duration of 2020.

This map shows the yearly mumps rates per 100,000 population. Counties with a rate of 0.1-0.3 per 100,000 population are: Pinellas, Hillsborough, Polk, Orange, Lee, Palm Beach, Broward, and Miami-Dade. Counties with a rate of 0.4-1.0 per 100,000 population are: Hernando, Highlands, and Martin. Counties with a rate of 1.1-1.8 per 100,000 population are: Alachua.

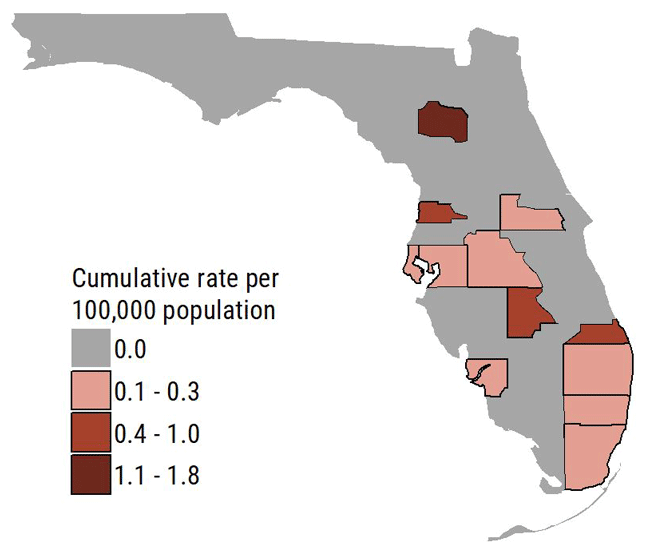
In 2020, Northwest Florida did not report any mumps cases while Alachua county had the highest cumulative incidence rate.

This image contains a summary of mumps cases reported by month in 2020 as compared to the previous 5-year average. February (5 cases) and March (6 cases) were above the previous 5-year-average. September (3 cases) was similar to the previous 5-year-average. January (2 cases), April (1 case), May (1 case), June (0 cases), July (0 cases), August (1 case), October (0 cases), November (0 cases), and December (0 cases) were below the previous 5-year-average.

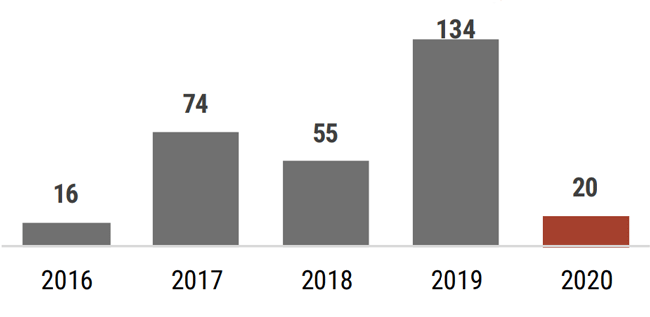
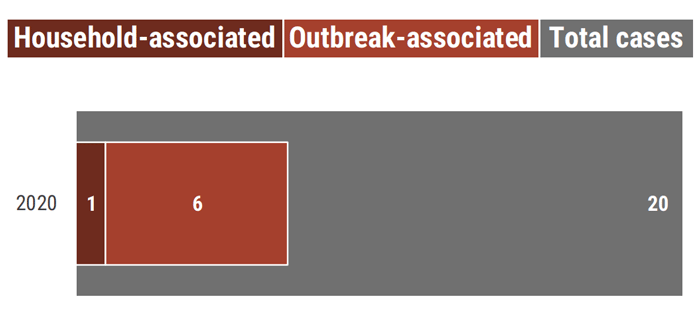
In 2020, 20 mumps cases were reported in 12 counties. Compared to 2019, this was a 85% decrease in reported mumps cases.

This image contains a summary of the total number of mumps cases reported from 2016 through 2020. In total for each year there have been: 16 in 2016, 74 in 2017, 55 in 2018, and 134 in 2019, and 20 in 2020.

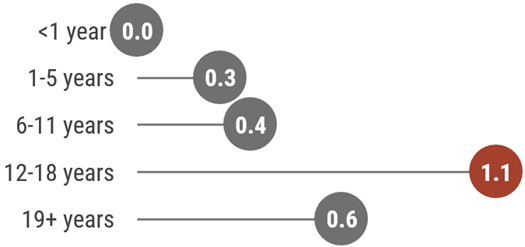
Mumps rates were highest among 19-34 years old at 0.3 cases per 100,000 population in 2020.

This image contains a summary of incidence rate per 100,000 by age group. In 2020, age incidence rates were: 0 per 100,000 for <1-year-olds, 0 per 100,000 for 1-5 year-olds, 0.1 per 100,000 for 6-11 year-olds, 0.1 per 100,000 for 12-18 year-olds, and 0.3 per 100,000 for 19-34 year-olds, 0 per 100,000 for 35-49 year-olds, 0.1 per 100,000 for 50-64 year-olds, and 0 per 100,000 for 65 year-olds and older.

Seven outbreak-associated cases and 13 household associated cases were identified in 2020. Transmission setting was college or school for 35% of cases and unknown for the remaining cases reported.

This image contains a summary of outbreak-associated cases reported in 2020. In 2020, 1 (5%) of 20 total cases were associated with transmission within households and 6 (30%) cases were outbreak-associated.

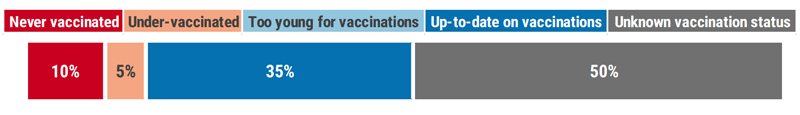
The majority of mumps cases in 2020 were not up-to-date on vaccinations or had unknown vaccination status.

Vaccination is the best way to prevent mumps infections.

This image contains the percentage of mumps cases by vaccination status for 2020. 10% of cases were never immunized, 5% of cases were under-vaccinated, 35% of cases were up-to-date on vaccinations, 0% of cases were too young for vaccination, and 50% of cases had unknown vaccinations status.

*Note: This page contains materials in the Portable Document Format (PDF). The free Acrobat Reader may be required to view these files.